Math Insight

Gut microbiota project

Group members:
Total points: 1
Grading rubric

To earn credit, a project must meet the following criteria.

CriterionMetNot met
Accurately interpret the model setup in terms of biology
Accurately determine both the short-term and the long-term dynamics of the model and interpret those dynamics in terms of the gut microbiota
Accurately analyze the impact of inflammatory bowel disease on the gut microbiota dynamics
Back up conclusions by R code that can be run to verify these results
Project receives creditYESNO
Submitting project

Submit the following by the due date.

  1. This cover sheet
  2. Answers to the project questions (typed or handwritten)
  3. Your R code (e-mail it to instructor)
R code expectations

Your submitted R code should be one script that when sourced does the calculations for at least the following questions: 2a, 2b, 2c, 2d, 2e, 4a, 4b. When sourced, the file must print the question number, e.g., by a command such as print("Question 2a"), and then print the corresponding answer.

Background

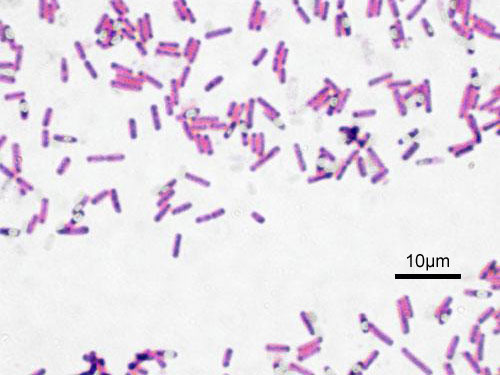
Bacillus subtilis, a species of Firmicutes bacteria
(Image: © Y tambe, CC BY-SA 3.0 wikimedia)

Humans have trillions of bacteria living within their guts, which are collectively referred to as the 'gut microbiota'. The gut microbiota is primarily made up of four main groups of bacteria: Actinobacteria, Bacteroidetes, Firmicutes, and Proteobacteria. Throughout a person's life, the relative abundance of each of these four groups changes. This process is similar to the ecological concept of succession.

The overarching questions for this project are:

  • What is the relative abundance of each of the four groups of bacteria in a person's gut over each short- and long-term timescales?
  • Does the gut microbiota ever reach any sort of equilibrium (here, a stable relative abundance of the four bacteria types)? If so, what factors influence this equilibrium?

The gut microbiota for a healthy human infant can be modeled with the equation: \begin{align} \begin{bmatrix}A\\B\\F\\P\end{bmatrix}_{t+1} = M \begin{bmatrix}A\\B\\F\\P\end{bmatrix}_t \end{align} \begin{align*} M = \begin{bmatrix}0.5&0&0&0\\ 0 &0.9 &0.05 &0.5\\ 0.5 &0.1 &0.85 &0.3\\ 0 &0 &0.1 &0.2 \end{bmatrix} \end{align*} where $A$ is the abundance of Actinobacteria, $B$ of Bacteroidetes, $F$ of Firmicutes, $P$ of Proteobacteria, and $t$ is the number of weeks since the infant's birth.

Here $M$ is the transition matrix, describing transitions among each of these four bacterial groups. Unlike in the sea turtle model (where transition from $A$ to $B$ represents an individual turtle changing from type $A$ to type $B$), here the transitions indicate the probability that an area of the gut that is dominated by group $A$ is taken over by group $B$ in the next time step.
  1. Step 1: map from math to biology
    1. What is the probability that an area of the gut dominated by Firmicutes transitions to being dominated by Proteobacteria in the next time step?
    2. When you add up all the numbers in each column of the matrix, what number do you get for each column? Why would this model have all column sums equal to this value? What are the implications on how to interpret the values of the state variables $A$, $B$, $F$, and $P$? (Hint: notice how we always start with an initial condition so that $A+B+F+P=1$. What happens to the sum $A+B+F+P$ over time?)

  2. Step 2: analyze the model
    1. Consider a newborn infant with a gut microbiota composed of entirely Firmicutes (e.g. $F=1$, $A=0$, $B=0$, $P=0$). What proportion of each microbe group would you expect to see after 1 week?
    2. What proportion of each microbe group would you expect to see in this infant after 10 weeks? 20 weeks? Plot the proportion in each group over time with R.
    3. An infant's delivery mode influences the initial gut microbiota: infants born vaginally typically start with gut bacteria similar to their mother's vagina (Firmicutes) while infants born via casearian section typically start with gut bacteria similar to their mother's skin (Actinobacteria). Suppose a caesarian-born infant starts with a gut microbiota composition of entirely Actinobacteria (e.g. $A=1$, $B=0$, $F=0$, $P=0$). What proportion of each microbe group would you expect to see after 1 week?
    4. What proportion of each would you expect to see in this infant after 10 weeks? 20 weeks? Does the proportion ever reach an equilibrium?
    5. Calculate the eigenvalues and eigenvectors of matrix M using the R command eigen. What is the dominant eigenvalue? What is the eigenvector corresponding to this eigenvalue?

      Given the observations from 1b, you could have already predicted the dominant eigenvalue. Explain how the observations from 1b are sufficient to determine this value of the dominant eigenvalue.

    6. Compare your answers from (a) and (c). Are they the same or different?
    7. Compare your answers from (b) and (d). Are they the same or different? How do they compare to your eigenvector value in (e)? (Remember, we can multiply an eigenvector by any non-zero number, and it is still the eigenvector. Therefore, we aren't interested in any differences from the eigenvector that are due just to the choice of eigenvector, including the choice made by the eigenvector code in R. To facilitate comparison with the eigenvector, multiply/divide the eigenvector by a number so that its sum matches your answers from (b) and (d).)

  3. Step 3: interpret the model analysis biologically
    1. Based on your answers to (2f) and (2g), what can you conclude about the impact of delivery mode (vaginal versus caesarian section) on each the short-term and long-term composition of an infant's gut microbiota?

  4. Step 4: comparison

    Some human diseases are associated with different gut microbiota. In an infant with inflammatory bowel disease (a chronic inflammation of the digestive system), suppose that the probability of transitioning between the different microbe classes is slightly different than that of the healthy infant above. For this infant, an area colonized with Bacteroidetes transitions to Firmicutes with probability 0.42, to Proteobacteria with probability 0.53, and remains Bacteroidetes with probability 0.05. An area colonized with Firmicutes transitions to Actinobacteria with probability 0.20, to Proteobacteria with probability 0.50, and remains Firmicutes with probability 0.25. Otherwise the transition probabilities are the same as for a healthy infant.

    1. Write down the new transition matrix.
    2. For a vaginally-born infant (starting with a gut microbiota composition of entirely Firmicutes) with inflammatory bowel disease, what proportion of each microbe group would you expect to see after 10 weeks? 20 weeks? Plot the proportion in each group over time with R. Does the proportion ever reach an equilibrium?
    3. Compare your results from (4b) to (2b). What can you conclude about the impact of disease on the long-term composition of an infant's gut microbiota?