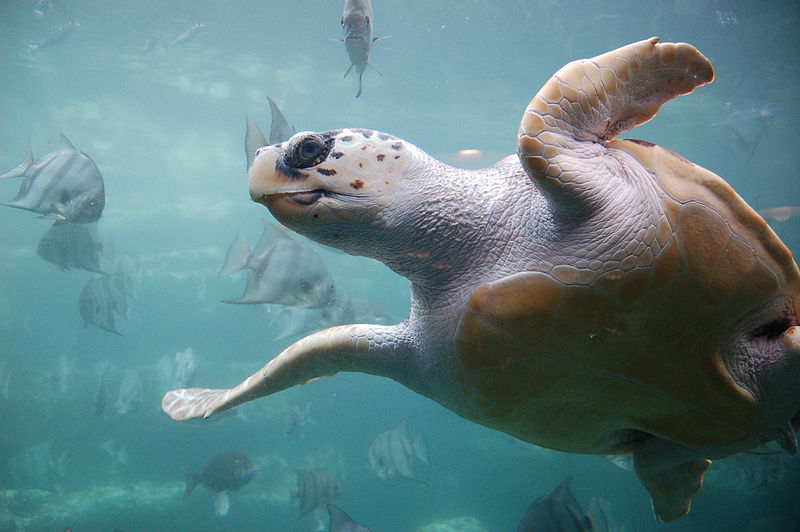
Loggerhead sea turtle project
Grading rubric
To earn credit, a project must meet the following criteria.
| Criterion | Met | Not met |
|---|---|---|
| Accurately construct a matrix model from the data | ||
| Accurately determine both the short-term and the long-term dynamics of the model and interpret those dynamics in terms of the sea turtle population | ||
| Form a recommendation for a sea turtle conservation strategy that is justified by the mathematical model |
| Project receives credit | YES | NO |
Submitting project
Submit the following by the due date.
- Answers to the project questions (typed or handwritten)
Background
Loggerhead sea turtles (Caretta caretta) are an endangered species of marine turtle found in the tropics across the world. Sea turtles are relatively long-lived, but individuals live for several years before they are able to start reproducing. Predation, egg poaching, pollution, and trapping in trawling nets all contribute to sea turtle mortality. In order to determine how to best conserve and manage sea turtle populations, we must first understand their current population dynamics.
The overarching questions for this project are:
- Are loggerhead sea turtle populations expected to increase, decrease or stay the same, over short- and long-term timescales?
- How will different conservation strategies influence turtle populations?
The model
Detailed studies of loggerhead sea turtle populations indicate that there are four different classes of juvenile loggerhead sea turtles: hatchlings, small juveniles, large juveniles, and subadults, each with slightly different survival probabilities. There are also three different classes of adults: novice (first-time) breeders, second-time breeders, and mature breeders, where each class has a different probability of survival and produces a different number of offspring on average.
Based on this, you decide to construct a matrix model for loggerhead sea turtles with seven classes: hatchlings (stage 1), small juveniles (stage 2), large juveniles (stage 3), subadults (stage 4), novice breeders (stage 5), second-time breeders (stage 6), mature breeders (stage 7).
Only adults reproduce but there are three adult classes each with a different fecundity (average number of offspring produced each year): novice breeders have a fecundity of 127, second-time breeders have a fecundity of 4, and mature breeders have a fecundity of 80.
Over the course of a year, each sea turtle either dies, matures into the subsequent class, or remains in the same class, and the probability of these events depends on the class. Hatchings either mature into small juveniles (with probability p=0.6747) or die (with probability p=0.3253), but do not stay in the hatchling class more than one year. Small juveniles mature into large juveniles (p=0.0486), stay as small juveniles (p=0.7370), or die (p=0.2144). Large juveniles mature into subadults (p=0.0147), stay as large juveniles (p=0.6610), or die (p=0.3243). Subadults either mature into novice breeders (p=0.0518), stay as subadults (p=0.6907), or die (p=0.257). Novice breeders either become second-time breeders (p=0.8091) or die (p=0.1909), but do not stay in the novice breeder class. Second-time breeders either become mature breeders (p=0.8091) or die (p=0.1909), but do not stay in the second-time breeder class. Mature breeders either remain mature breeders (p=0.8089) or die (p=0.1911).