Applet: Gradient and directional derivative on a mountain
Applet loading
Applet loading
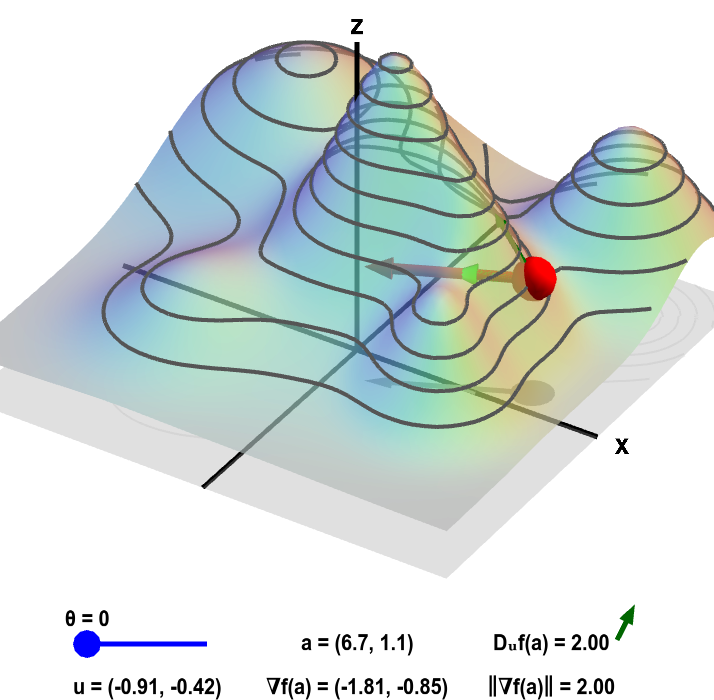
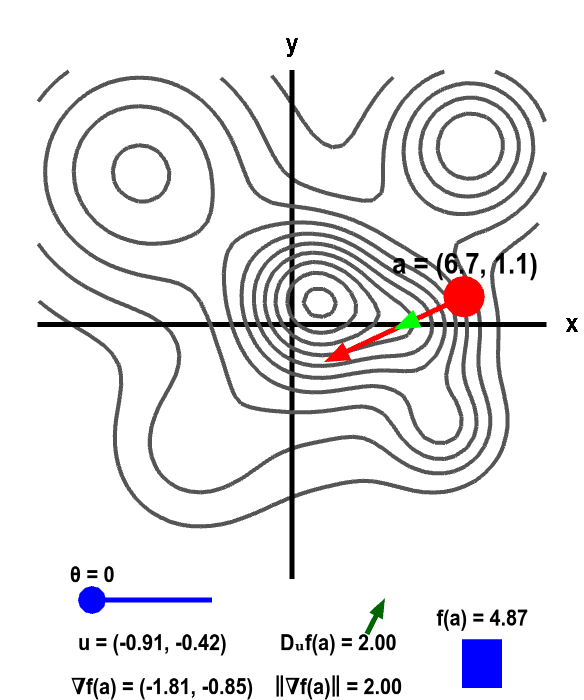
The height of a mountain range described by a function $f(x,y)$ is shown as surface plot in three-dimensions (left) and a two-dimensional level curve plot (right). In each panel, a red point can be moved by the mouse to change the location $\vc{a}$ where the gradient $\nabla f(\vc{a})$ is calculated. Since $f$ is a function of two variables, the point $\vc{a}$ and the gradient are two-dimensional. The two-dimensional point $\vc{a}$ is illustrated by the shadow of the red point on the $xy$-plane below the surface plot and by the red point itself on the level curve plot. The two dimensional gradient vector $\nabla f(\vc{a})$ is illustrated by the red vector emanating from the red point as well as by its shadow below the surface plot.
The light green two-dimensional vector $\vc{u}$ points at an angle $\theta$ (changeable via the slider) from the gradient. (It is also represented by its shadow below the surface plot.) The value of the directional derivative $D_{\vc{u}}f(\vc{a})$ is the slope of the dark green vector tangent to the surface, which is reproduced next to the value of $D_{\vc{u}}f(\vc{a})$ shown at the bottom of each panel. The value of the directional derivative is compared to the magnitude of the gradient $\| \nabla f(\vc{a})\|$. The height of the surface $f(\vc{a})$ is also illustrated by the bar in the lower right of the second panel.
Applet links
This applet is found in the pages
General information about three.js applets
The applet was made using three.js and requires Javascript as well as a browser that supports WebGL. For most three.js applets, you can drag with the mouse to rotate the view, drag with the right button to pan, and zoom in/out with the mouse wheel. Many applets contain points that you can drag to change values of variables.