Applet: Level curves of a hyperbolic paraboloid
Applet loading
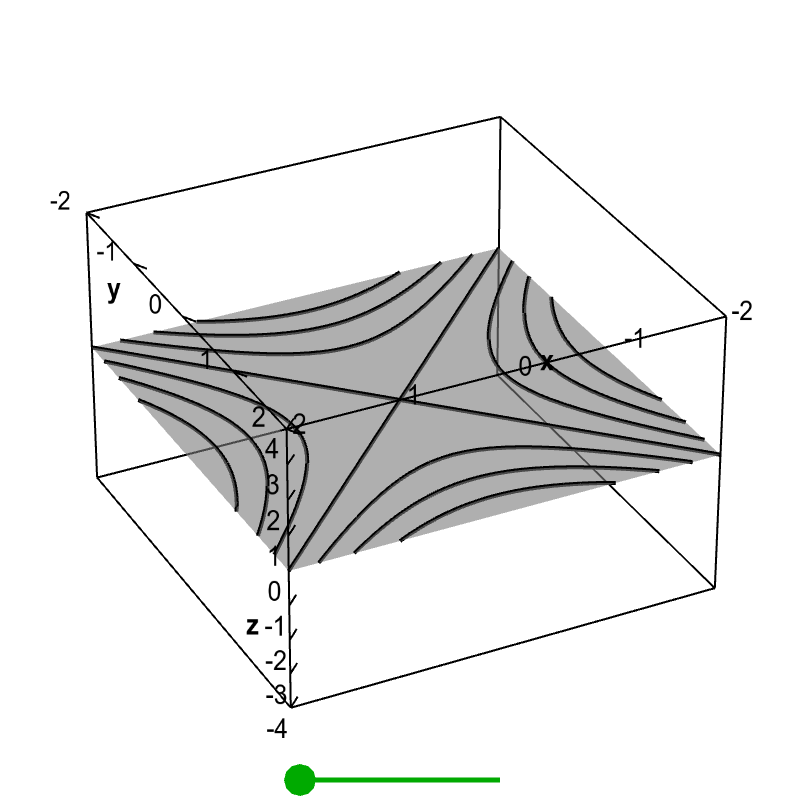
When the green point on the slider is to the left, as it is in the default view, the figure shows a standard level curve plot of $f(x,y)=x^2-y^2$, though it is floating in a three dimensional space. When you drag the green point to the right, each level curve $f(x,y)=c$ moves to the height $z=c$, so that they are in the same position as in the graph of $z=f(x,y)$. In this way, the figure demonstrates the correspondence between the level curve plot and the graph of the function.
Applet links
This applet is found in the pages
General information about three.js applets
The applet was made using three.js and requires Javascript as well as a browser that supports WebGL. For most three.js applets, you can drag with the mouse to rotate the view, drag with the right button to pan, and zoom in/out with the mouse wheel. Many applets contain points that you can drag to change values of variables.