Applet: Line parametrization
Applet loading
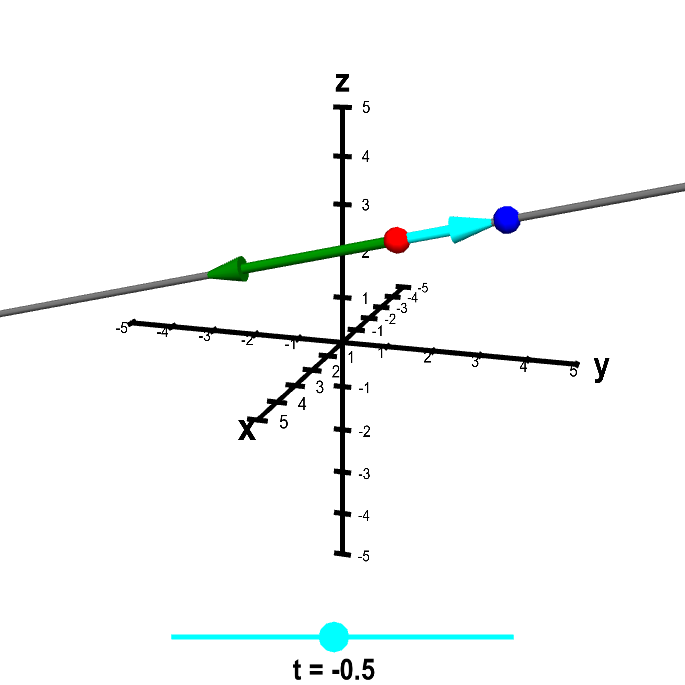
The blue point $\color{blue}{\vc{x}}$ sweeps out the line parameterized by $\color{blue}{\vc{x}} = \color{red}{\vc{a}} + t\color{green}{\vc{v}}$, where $\color{red}{\vc{a}}$ is the red point and $\color{green}{\vc{v}}$ is the green vector. Change the line by dragging the red point or green arrow heads. Change the position of $\color{blue}{\vc{x}}$ along the line by dragging either the point itself or the cyan dot on the slider that determines the value of $t$. Dragging elsewhere on the figure rotates the graph.
Notice that when $t=0$, then $\color{blue}{\vc{x}}=\color{red}{\vc{a}}$. And when $t=1$, $\color{blue}{\vc{x}}$ is on top of the endpoint of the vector $\color{green}{\vc{v}}$, which is at position $\color{red}{\vc{a}}+\color{green}{\vc{v}}$.
Applet links
This applet is found in the pages
General information about three.js applets
The applet was made using three.js and requires Javascript as well as a browser that supports WebGL. For most three.js applets, you can drag with the mouse to rotate the view, drag with the right button to pan, and zoom in/out with the mouse wheel. Many applets contain points that you can drag to change values of variables.