Introduction to the Interactive Gallery of Quadric Surfaces
The Interactive Gallery of Quadric Surfaces was written by Jon Rogness and appeared in the 2005 volume of Journal of Online Mathematics, an electronic journal of the Mathematical Association of America.
The interactive gallery is a tour through the various quadric surfaces, which are basic surfaces determined by quadratic equations in $x$, $y$, and $z$. They are natural three-dimensional extensions of the two-dimensional conic sections (ellipses, parabolas, and hyperbolas) and are frequently used as example surfaces.
Each page in the interactive gallery features interactive applets that allow you to examine the cross sections of the surfaces as well as explore how the coefficients change the surfaces.
You can begin your exploration of the gallery with a page describing quadric surfaces in general.
A Note about Domains
Sometimes a computer can graph a surface in more than one way. Look at the two pictures below; they both show graphs of the function $z = x^2+y^2$. The one on the left is probably more familiar, and it's what most of us would draw by hand. The picture on the right can be useful, though, because the gridlines on the surface show you the cross sections $x=c$ and $y=c$ of the surface.
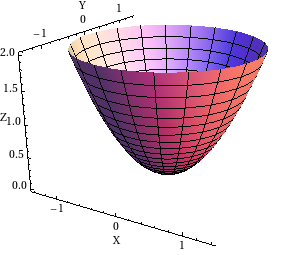
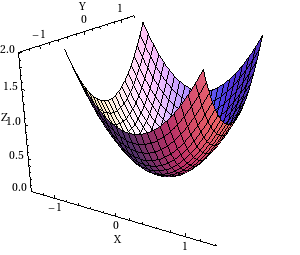
In technical terms, the two pictures show graphs of the same function but with different domains. On the left the domain is a disk, described by \begin{gather*}0 \le x^2+y^2 \le 2.\end{gather*} On the right, the domain is a square, \begin{gather*} -1 \le x \le 1\\ -1 \le y \le 1 \end{gather*}
In the gallery of quadric surfaces, we'll focus on the surfaces with square domains to emphasize the vertical cross sections. We've also included certain pictures using the domain of a disk. You might be surprised how different some of the pictures will look when you change the domain.
In fact, that leads to a good way to gauge how well you understand the quadric surfaces. On each page you'll be able to adjust the coefficients of the equation. Do this with both domains, and see if you can tell that it affects both graphs in the same way.