Applet: Crossing a mountain range
Applet loading
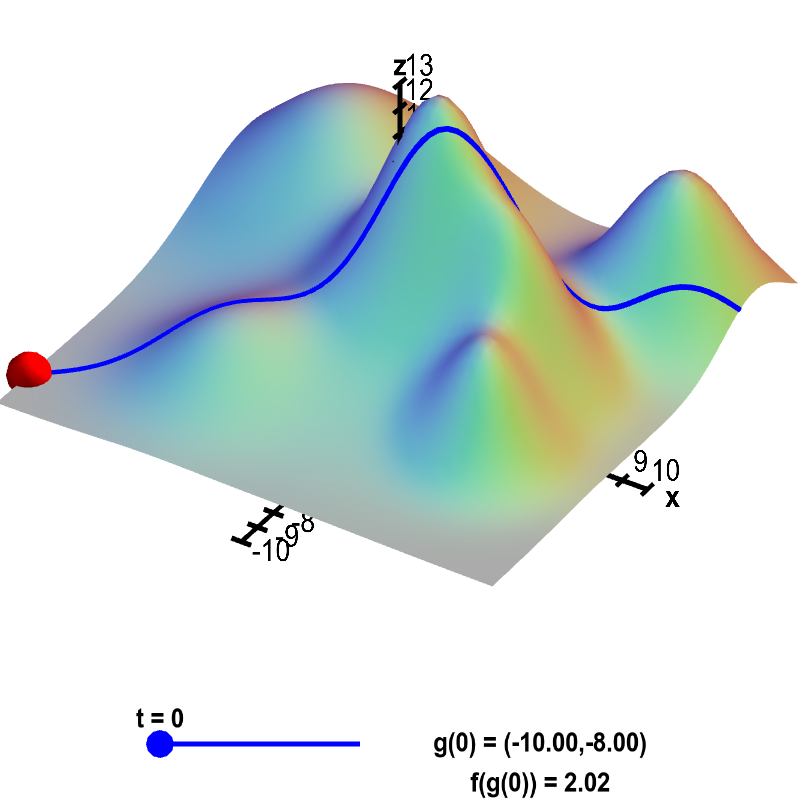
An illustration of a path through a mountain range. The height $f(x,y)$ of a mountain range at position $(x,y)$ is shown by the surface plot. A path through the mountains is shown by the blue curve. The $xy$-coordinates along the path at time $t$ are given by the function $\vc{g}(t)=(g_1(t),g_2(t))$. The blue curve is drawn to be raised at the height the mountain range $f(\vc{g}(t))$ so that it appears to be describing the position of someone walking through the mountain range. For any value of $t$ (changeable via the slider), the $x$ and $y$-coordinates of the red point are $\vc{g}(t)$, and its height is $f(\vc{g}(t))$, as shown in the lower right. In other words, the coordinates of the red point are $(g_1(t),g_2(t),f(g_1(t),g_2(t))$, and the blue curve is the set of all those points.
Applet links
This applet is found in the pages
General information about three.js applets
The applet was made using three.js and requires Javascript as well as a browser that supports WebGL. For most three.js applets, you can drag with the mouse to rotate the view, drag with the right button to pan, and zoom in/out with the mouse wheel. Many applets contain points that you can drag to change values of variables.