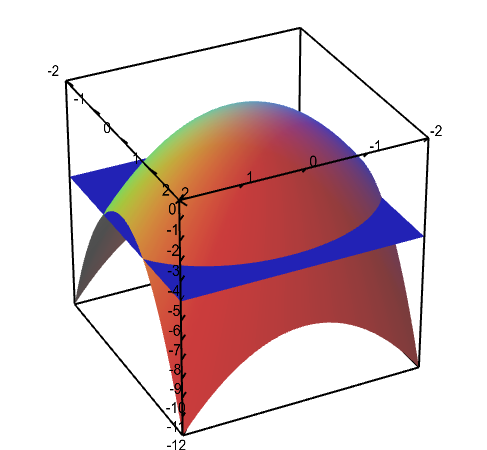
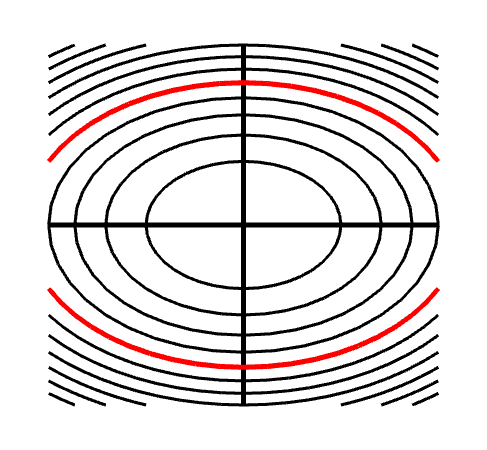
Applet: Level curves of an elliptic paraboloid shown with graph
Applet loading
Applet loading
The graph of the function $f(x,y)=-x^2-2y^2$ is shown is the first panel along with a level curve plot in the second panel. The level curve $f(x,y)=c$ is shown in red in the level curve plot, which is the same as the slice of the graph $z=f(x,y)$ by the plane $z=c$. You can change $c$ by dragging the plane slicing the graph up or down with the mouse. You can also change $c$ by dragging the red level curve.
Applet links
This applet is found in the pages
General information about three.js applets
The applet was made using three.js and requires Javascript as well as a browser that supports WebGL. For most three.js applets, you can drag with the mouse to rotate the view, drag with the right button to pan, and zoom in/out with the mouse wheel. Many applets contain points that you can drag to change values of variables.