Image: Diagram illustrating influence of flux of molecules above and below a region
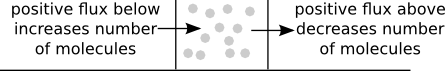
Image file: flux_molecules_above_below.png
Source image file: flux_molecules_above_below.svg
Image file: flux_molecules_above_below.png
Source image file: flux_molecules_above_below.svg