List of images
 Image: 3.29 anteaters
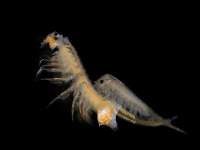
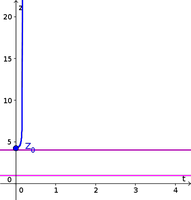
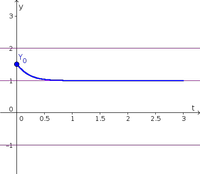
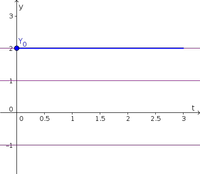
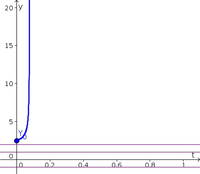
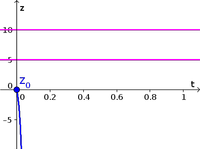
A dynamical system model might posit the existence of 3.29 anteaters Image: Area of parallelogram
Illustration of the formula for the area of a parallelogram spanned by two vectors.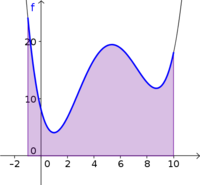 Image: Shaded area under a curve
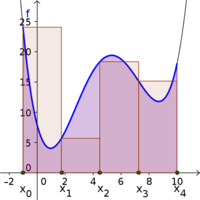
The area underneath the graph of a function and above an interval on the x-axis is illustrated as a shaded region.


« Previous
| Page 1 of 16 |
Next »