List of images
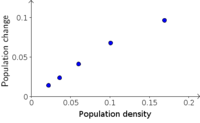 Image: Change in bacteria population density as a function of bacteria population density
Changes in experimental measurements of bacteria population density are plotted versus the population density at the beginning of the interval.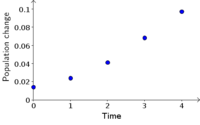 Image: Change in bacteria population density as a function of time
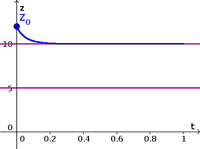
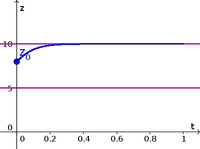
Changes in experimental measurements of bacteria population density are plotted versus time index.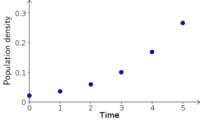 Image: Bacteria population density as a function of time
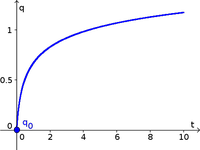
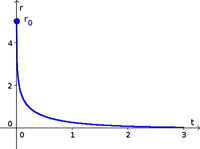
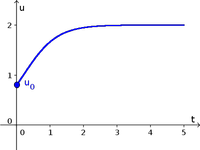
Experimental data from measurements of bacteria population density are plotted versus time index.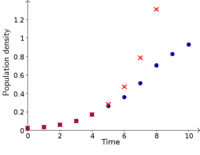 Image: Bacteria population density as a function of time, for a long time period
Experimental data from measurements of bacteria population density over a long period are plotted with exponential growth model.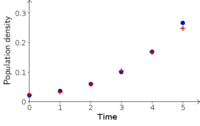 Image: Comparing evolution of bacteria population density with a parabola model
Experimental data from measurements of bacteria population density are compared with a model where the population size is a quadratic function of time.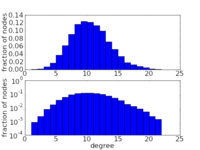 Image: Binomial degree distribution
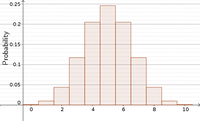
Histograms of a binomial degree distribution of a network with 10,000 nodes.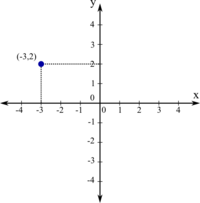 Image: Cartesian axes in plane the plane with point
The Cartesian coordinate system in the plane is illustrated by a point and the Cartesian axes Image: Counterclockwise oriented upper half disk
A curve around the upper half of a disk, oriented counterclockwise.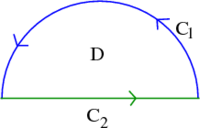 Image: Counterclockwise oriented upper half disk
Two curves form the boundary of the upper half of a disk, oriented counterclockwise. Image: Chain rule with geometric objects
The chain rule formula in terms of geometric objects.

« Previous
| Page 2 of 16 |
Next »