Image: Plot of power-law degree distribution on log-log scale
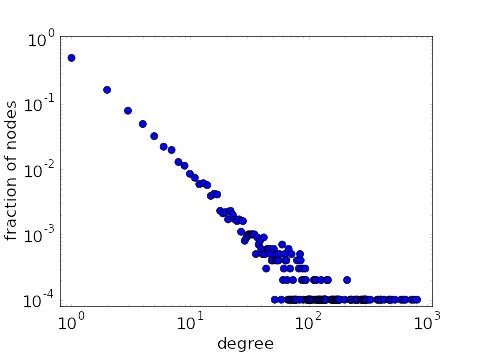
In a scatter plot of a power-law degree distribution on log-log scale, points lie approximately along a line.
Image file: power_law_degree_distribution_scatter.png
Source image file: power_law_degree_distribution_scatter.py
Source image type: Python
Image links
This image is found in the pages