Image: The change of a rabbit population versus population size
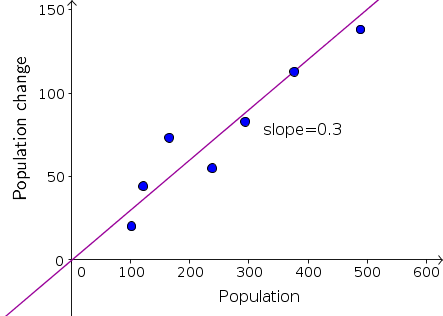
Scatter plot of the change of a rabbit population versus population size, fitted with a line through the original with slope 0.3. The points are based on the following data.
| Time (weeks) | Population size | Population change |
|---|---|---|
| 0 | 101 | 20 |
| 5 | 121 | 44 |
| 10 | 165 | 73 |
| 15 | 238 | 55 |
| 20 | 293 | 83 |
| 25 | 376 | 113 |
| 30 | 489 | 138 |
| 35 | 627 |
Image file: rabbit_population_change_versus_population_line_example.png
Source image file: rabbit_population_change_versus_population_line_example.ggb
Source image type: Geogebra
Image links
This image is found in the pages