Image: Change in bacteria population density as a function of bacteria population density
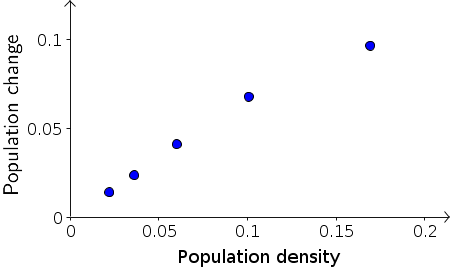
Changes in experimental measurements of bacteria population density are plotted versus the population density at the beginning of the interval. The data was taken from the following table with time rescaled so that each snapshot was one unit of time.
| Time (min) | Time Index $t$ | Population Density $B_t$ | Pop Change/ $B_{t+1}\nobreak{-}B_t$ |
|---|---|---|---|
| 0 | 0 | 0.022 | 0.014 |
| 16 | 1 | 0.036 | 0.024 |
| 32 | 2 | 0.060 | 0.041 |
| 48 | 3 | 0.101 | 0.068 |
| 64 | 4 | 0.169 | 0.097 |
| 80 | 5 | 0.266 |
Image file: bacteria_density_change_versus_density.png
Source image file: bacteria_density_change_versus_density.ggb
Source image type: Geogebra
Image links
This image is found in the pages