Image: Bacteria population density as a function of time, for a long time period
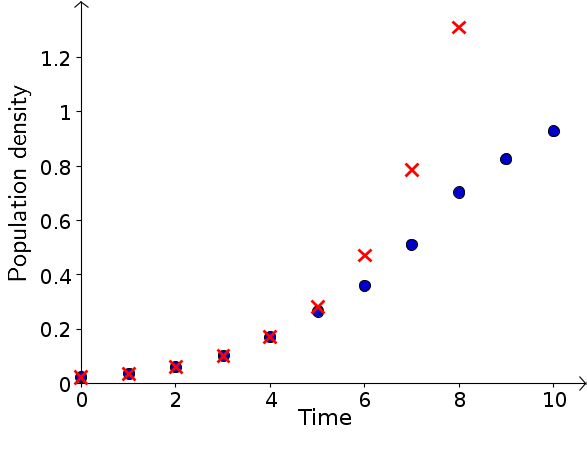
Experimental data from measurements of bacteria population density are plotted versus time index (blue points). Predictions of an exponential growth model that was fit to the first five points are shown by the red X's. The data was taken from the following table with time rescaled so that each snapshot was one unit of time.
| Time (min) | Time index $t$ | Population Density |
|---|---|---|
| 0 | 0 | 0.022 |
| 16 | 1 | 0.036 |
| 32 | 2 | 0.060 |
| 48 | 3 | 0.101 |
| 64 | 4 | 0.169 |
| 80 | 5 | 0.266 |
| 96 | 6 | 0.360 |
| 112 | 7 | 0.510 |
| 128 | 8 | 0.704 |
| 144 | 9 | 0.827 |
| 160 | 10 | 0.928 |
Image file: bacteria_density_versus_time_long.png
Source image file: bacteria_density_versus_time_long.ggb
Source image type: Geogebra
Image links
This image is found in the pages