Image: Comparing evolution of bacteria population density with a parabola model
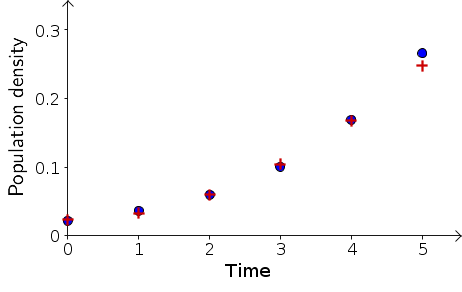
Experimental data from measurements of bacteria population density are compared with a model where the population size is a quadratic function of time. The quadratic model $B_t= 0.0236 + .000186t + 0.00893 t^2$ was determined by fitting a parabola to the data points. The data was taken from the following table with time rescaled so that each snapshot was one unit of time.
| Time (min) | Time index | Population Density |
|---|---|---|
| 0 | 0 | 0.022 |
| 16 | 1 | 0.036 |
| 32 | 2 | 0.060 |
| 48 | 3 | 0.101 |
| 64 | 4 | 0.169 |
| 80 | 5 | 0.266 |
Image file: bacteria_density_versus_time_parabola.png
Source image file: bacteria_density_versus_time_parabola.ggb
Source image type: Geogebra
Image links
This image is found in the pages