Image: Binomial degree distribution

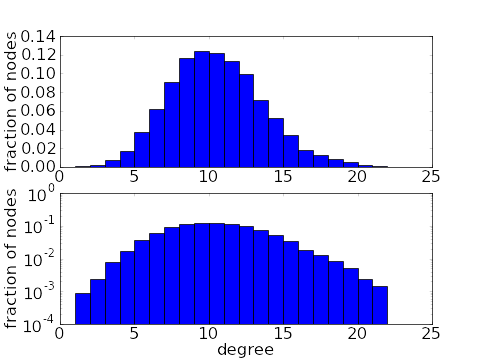
Histograms of a binomial degree distribution of a network with 10,000 nodes. The top histogram is on a linear scale while the bottom shows the same data on a log scale. To obtain the degree distribution, we let the probability of a connection be $p=10/10,000$, so the average degree is 10.
Image file: binomial_degree_distribution.png
Source image file: binomial_degree_distribution.py
Source image type: Python
Image links
This image is found in the pages