List of images
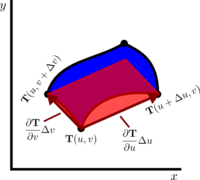 Image: Approximating region as parallelogram to calculate area under transformation
To estimate the area of a small rectangle under a map, one can approximate the image of the rectangle as a parallelogram.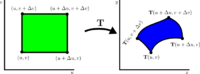 Image: Area transformation for change of variables in double integrals
Illustration of how a change of variables map changes the area and shape of a rectangle.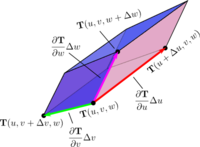 Image: Parallelepiped approximation underlying volume transformation calculation
To estimate the volume of a small box under a map, one can approximate the image of the box as a parallelepiped. Image: Box chopped into smaller boxes
A box is chopped into smaller boxes, illustrating a Riemann sum underlying a triple integral.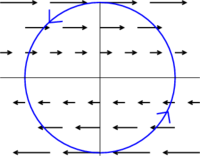 Image: Shear flow gives circulation around circle
A vector field representing a shear flow leads to circulation around the unit circle.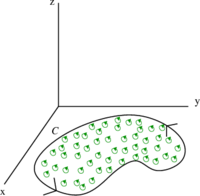 Image: Circulation in a planar region embedded in three dimensions
Microscopic and macroscopic circulation in a region of the $xy$-plane, viewed as a surface in three dimensions. Image: The curve used to derive a formula for the circulation per unit area
The rectangular curve used in the derivation of the circulation per unit area. Image: The vector field approximation used to derive a formula for the circulation per unit area
A vector field is approximated to be constant on each side of a rectangular curve in a step of the derivation of the circulation per unit area formula. Image: The vector field tangents used to derive a formula for the circulation per unit area
The approximations for the vector field tangents along the rectangular curve used in a step of the derivation of the circulation per unit area formula. Image: A closed curve
A simple closed curve, oriented counterclockwise.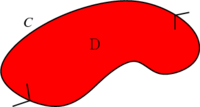 Image: A closed curve with region in interior
A simple closed curve in two dimensions with a planar region in its interior. Image: A closed path including two points
A closed path passes through two points.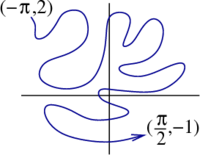 Image: A complicated curve
A complicated curve between two points.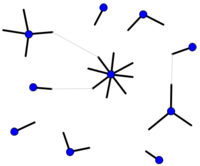 Image: Algorithm underlying the configuration model
Illustration of the configuration model algorithm of randomly connecting half-edges determining the degree of each node.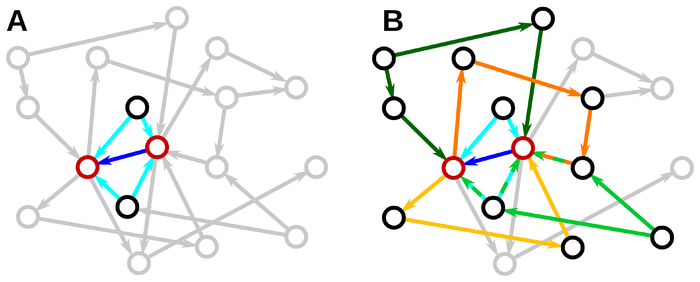 Image: Connectivity induces correlations
Illustration of how different network connections can induce correlations between a pair of nodes.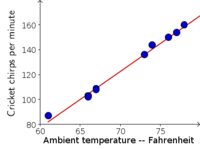 Image: Cricket chirps per minute as a function of temperature
A graph of the number of cricket chirps recorded per minute versus the air temperature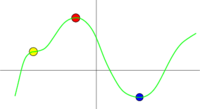 Image: Critical points of one variable function
Three types of critical points of a function of one variable.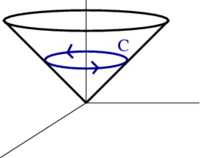 Image: Curve formed from intersection of cone and a plane
A closed circular curve is formed from the intersection of a cone and a horizontal plane.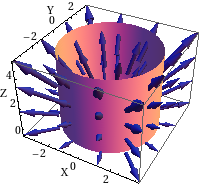 Image: Flux of a vector field out of a cylinder
The flux of a vector field out of a cylindrical surface.
« Previous
| Page 3 of 16 |
Next »