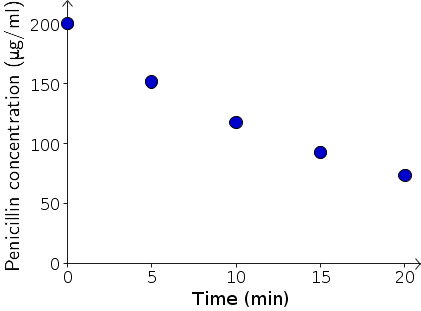
Image: Penicillin concentration versus time

This graph shows data for serum penicillin concentrations at 5 minute intervals for the 20 minutes following a bolus injection (a one-time injection) of 2 g into the serum of “five healthy young volunteers” (read “medical students”) taken from T. Bergans, Penicillins, in Antibiotics and Chemotherapy, Vol 25, H. Sch
Image file: penicillin_concentration_versus_time_2_g_bolus.png
Source image file: penicillin_concentration_versus_time_2_g_bolus.ggb
Source image type: Geogebra
Image links
This image is found in the pages