Image: Power law degree distribution
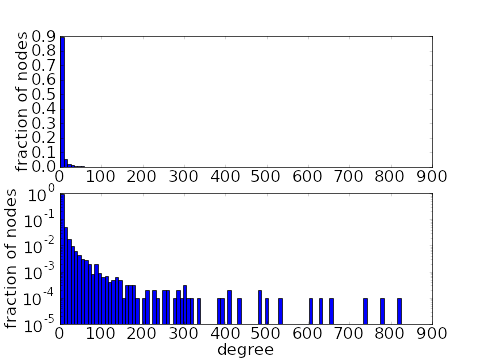
Histograms of a power law degree distribution of a network with 10,000 nodes. The top histogram is on a linear scale while the bottom shows the same data on a log scale. To obtain the degree distribution, we used a power law exponent of $-2$ and maximum degree of 1000, resulting in an average degree of around 7.
Image file: power_law_degree_distribution.png
Source image file: power_law_degree_distribution.py
Source image type: Python
Image links
This image is found in the pages