Approximating a nonlinear function by a linear function
Approximating a nonlinear function by a linear function.
Linear functions are nice and easy to deal with. But, in many cases and applications, one doesn't have a linear function to work with. Instead, one has a nonlinear function. One part of calculus can be viewed as approximating nonlinear functions by linear functions.
The secant line
How can we approximate nonlinear functions by linear functions? One way is through the secant line, which is a line through two points on the graph of the function.
Let's denote the function by $f$. To form the secant line, pick two values of $x$, say $x=x_0$ and $x=x_1$. Draw a line through $(x_0,f(x_0)$ and $(x_1,f(x_1))$. This line is the secant line.
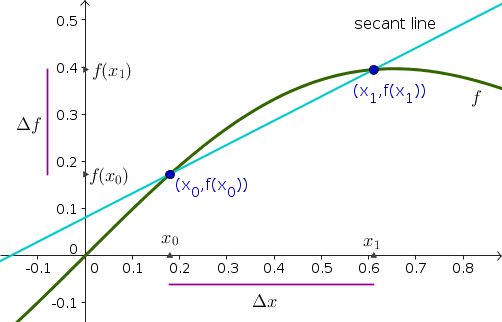
The secant line approximates the function near those two points. The slope of the secant line gives the average rate of change. The slope of the secant line is \begin{align*} \text{average rate of change} = \frac{\Delta f}{\Delta x} = \frac{f(x_1)-f(x_0)}{x_1-x_0}. \end{align*}
If $f$ were a linear function, its slope wouldn't depend on the choice of $x_0$ and $x_1$. For nonlinear $f$, one will get different slope as change values of $x$. In the below applet, you can change the values of $x_0$ and $x_1$ and see how the secant line changes. In the applet, we've relabeled $x_1$ as $x_0+\Delta x$, and you change $x_1$ by changing the difference $\Delta x$ between $x_0$ and $x_1$. In terms of $\Delta x$, the slope of the secant line is \begin{align*} \text{average rate of change} = \frac{\Delta f}{\Delta x} = \frac{f(x_0+\Delta x)-f(x_0)}{\Delta x}. \end{align*}
The slope of a secant line. The line (in red) passing through two points (large blue and smaller cyan) on the graph of the function $f$ (in green) is a secant line. The large blue point is at the location $(x_0,f(x_0))$, which you can change by dragging the point or typing in a value for $x_0$. The smaller cyan point is at the location $(x_0+\Delta x,f(x_0+\Delta x))$, which you can change by dragging the point. You can also change $\Delta x$ by typing in a value or changing the length of the purple $\Delta x$ line segment (drag small cyan point). You cannot change $\Delta y$ directly, as it is calculated as $\Delta y = f(x_0+\Delta x)-f(x_0)$. The slope of the secant line is $\frac{\Delta y}{\Delta x}$. As you let $\Delta x$ approach zero, the two points become closer together, and the secant line becomes closer to the tangent line of the graph of $f$. However, if you set $\Delta x=0$, then the secant line is not defined, and the slope $\frac{\Delta y}{\Delta x}=\frac{0}{0}$ is also not defined. However, if $\Delta x$ is very small, but not zero, the secant line becomes very close to the tangent line, which can be thought of as the limit of the secant line as $\Delta x$ approaches zero. If you click the “show limit for $\Delta x=0$” check box, then when you enter $\Delta x=0$, the applet instead shows the limiting tangent line. The slope of the tangent line, denoted by $\frac{dy}{dx}$ is the limit $\lim_{\Delta x \to 0}\frac{\Delta y}{\Delta x}$ and is also displayed. You can use the buttons at the top to zoom in and out as well as pan the view.
The tangent line
The secant line is a good approximation of the average rate that $f$ changes over the period between $x_0$ and $x_1$. However, the secant line isn't a good approximation of $f$ when we zoom in on the point $(x_0,f(x_0))$. As we zoom in, we see that the secant line and the graph of $f$ match at the point $(x_0,f(x_0))$ but then move in different directions. The graph of $f$ and the secant line have different slopes.
To make the secant line a better approximation for the zoomed-in view, we need to shrink the $\Delta x$ used to calculate the secant line. If you make $\Delta x$ smaller and smaller in the above applet, the secant line becomes a better and better approximation for the function right near the value of $x_0$.
What if we want the best possible approximation of $f$ right near the point $x_0$? Unfortunately, the solution cannot be as simple as setting $\Delta x$ equal to zero. If you make $\Delta x$ zero, then the secant line does not exist. When $\Delta x=0$, the two points $(x_0,f(x_0))$ and $(x_0+\Delta x, f(x_0+\Delta x))$ are the same point and therefore do not determine a line. The formula for the slope is also not defined. If we plug in $\Delta x=0$, then the change in $f$, $\Delta f$ is also zero. The slope of the secant line would be $$\frac{\Delta f}{\Delta x}=\frac{0}{0}=\text{undefined}.$$
To keep the slope and the secant line defined, we need to keep $\Delta x$ from being exactly zero. On the other hand, we want to make $\Delta x$ very small, so that we can match the behavior of $f$ right near the point $x_0$. The solution to this problem is to use a limit, one of the fundamental notions underlying calculus.
Right now, we won't make the notion of a limit precise, but just give the general idea. The idea is that, although we can't make $\Delta x$ exactly equal to zero, we can make it smaller and smaller. As we make $\Delta x$ very close to zero, the secant line matches the graph of the function around the point $x_0$ very well.
The limit is the idea of making $\Delta x$ arbitrarily small. As you can explore with the applet, as you start to make $\Delta x$ very small, such as $\Delta x = 0.01$, $\Delta x = 0.001$, or $\Delta x = 0.0001$, the secant line and its slope $\frac{\Delta f}{\Delta x}$ change very little. In fact, the slope is approaching a particular value, and the secant line is approaching a particular line, as $\Delta x$ gets close zero.
The value that the slope $\frac{\Delta f}{\Delta x}$ is approaching as $\Delta x$ gets closer and closer to zero is called the limit of $\frac{\Delta f}{\Delta x}$ as $\Delta x$ approaches zero, which we write as \begin{align*} \lim_{\Delta x \to 0} \frac{\Delta f}{\Delta x} &= \lim_{\Delta x \to 0}\frac{f(x_0+\Delta x)-f(x_0)}{\Delta x}. \end{align*} We denote this slope by $\frac{df}{dx}$ and refer to it as the instantaneous rate of change of the function at $x_0$ \begin{align*} \text{instantaneous rate of change} &= \frac{df}{dx} = \lim_{\Delta x \to 0} \frac{\Delta f}{\Delta x}\\ &= \lim_{\Delta x \to 0}\frac{f(x_0+\Delta x)-f(x_0)}{\Delta x}. \end{align*}
The line through the point $(x_0,f(x_0))$ with slope $\frac{df}{dx}$ is called a tangent line to the graph of $f$. The slope $\frac{df}{dx}$ is the derivative of $f$ at $x=x_0$. To emphasize that this slope is computed at the point $x=x_0$, we often write the derivative as $$\frac{df}{dx}\bigg|_{x=x_0}.$$ We also denote the derivative by $f'(x_0)$. Both notations refer to the same thing. The derivative is the slope of the tangent line, but we also say that the slope of the function itself is the derivative.
The derivative of $f$ depends on the point $x_0$ where it is evaluated. A nonlinear function will have a different slope at different points. To explore the derivative and tangent line of $f$ in the above applet, check the “show limit for $\Delta x=0$” checkbox. Then, move the point around to see how the tangent line and its slope vary as you change $x_0$.
Thread navigation
Math 1241, Fall 2020
- Previous: In-class exam: Discrete dynamical systems exam
- Next: Problem set: Approximating a nonlinear function by a linear function
Math 201, Spring 22
Similar pages
- Introduction to differentiability in higher dimensions
- The multivariable linear approximation
- Examples of calculating the derivative
- The definition of differentiability in higher dimensions
- Introduction to Taylor's theorem for multivariable functions
- The idea of the derivative of a function
- Derivatives of polynomials
- Derivatives of more general power functions
- A refresher on the quotient rule
- A refresher on the product rule
- More similar pages