Surfaces as graphs of functions
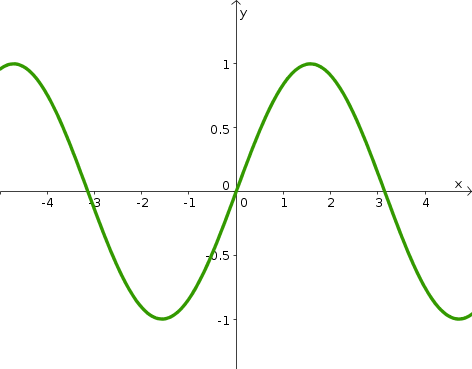
If $f$ is a scalar-valued function of a single variable, $f:\R \to \R$ (confused?), then the graph of $f$ is the set of points $(x,f(x))$ for all $x$ in the domain of $f$. When often call this the graph of $y=f(x)$, since we think of the points as lying in the $xy$-plane. When plotting the points in the $xy$-plane, they typically form a curve a points, such as the graph of $f(x)=\sin x$ shown below.
We define the graph of a scalar-valued function of two variables, $f: \R^2 \to \R$ in the same way. The graph is the set of points $(x,y,f(x,y))$ for all $(x,y)$ in the domain of $f$. When often call this the graph of $z=f(x,y)$, since we think of the points as lying in $xyz$-space. You may not find this formal definition particularly enlightening, but we can show how the graph of $f(x,y)$ is a surface.
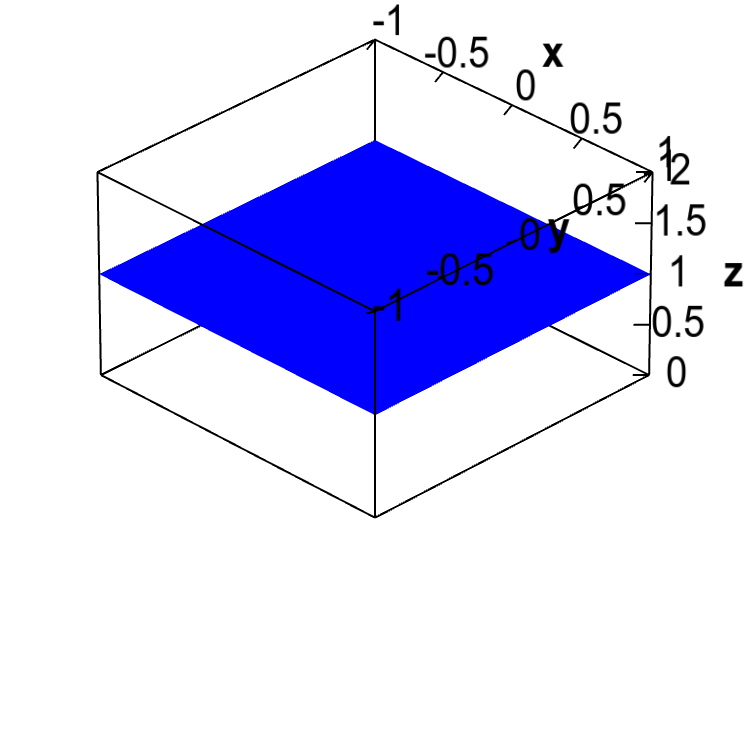
The function f takes two inputs, $x$ and $y$, and returns a single number, which we call $z$. If we draw the $x$-$y$-$z$ coordinate axes in the standard way, the $z$-axis represents height, and this is the key to graphing $f(x,y)$. If you choose a point $(x,y)$ in the $xy$-plane, then $z=f(x,y)$ represents the height of the graph at that point. For example, here's the graph of a simple function, $g(x,y)=1$. No matter what values you choose for $x$ and $y$, the function $g$ will always return (“a height of”) one.
Applet loading
A horizontal plane. The graph of the function $g(x,y)=1$ is the horizontal plane of height 1.
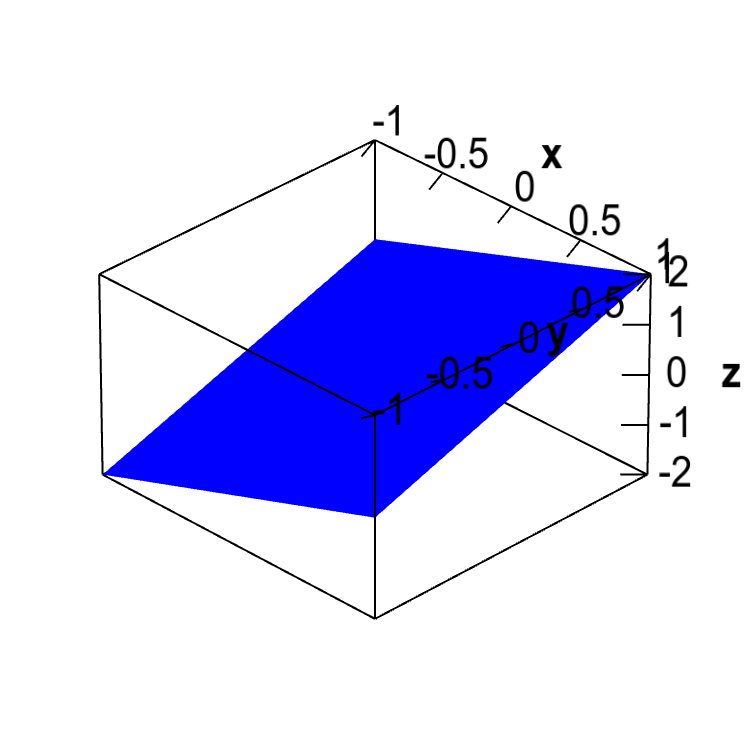
The graph of the single variable function $g(x)$ is a line with slope 1 through the origin. Can you envision what the graph of its generalization to two variables, the function $g(x,y)=x+y$, will look like? It won't be a line, but a plane. This graph will not have a constant height of one, but you should be able to make some observations:
- If $y=-x$, then $g(x,y)=0$.
- If $x$ and $y$ are both positive, then $g(x,y) > 0$.
- If $x$ and $y$ are both negative, then $g(x,y) <0$.
- If you fix either $x$ or $y$ and increase the other variable, the function will increase with a slope of one.
Can you see if these are true from the graph?
Applet loading
An angled plane. The graph of the function $g(x,y)=x+y$ is an angled plane.
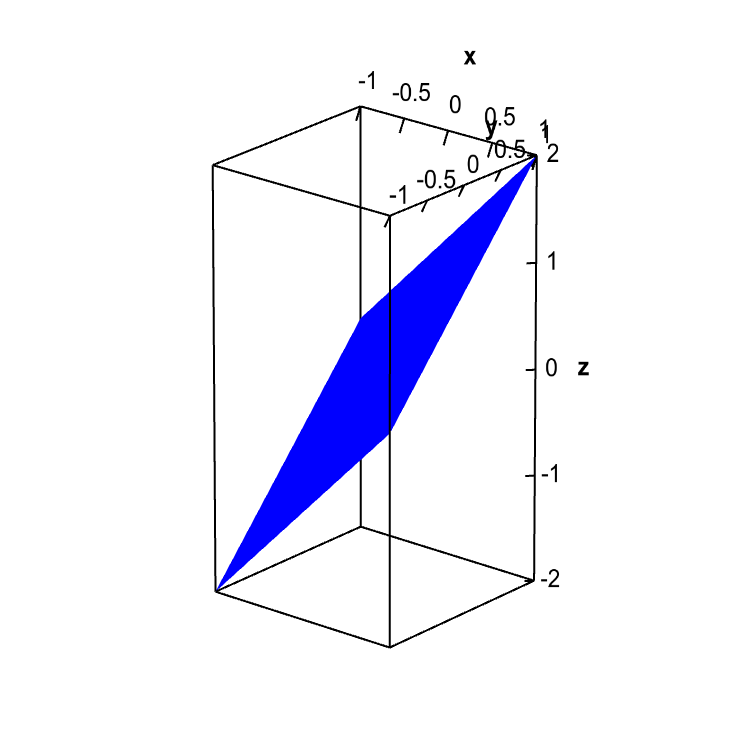
One thing you have to notice is that the $z$-axis goes from -2 to 2, which means the “height” is zero halfway up the box, not at the bottom. The slopes of the plane are hard to visualize as the $z$-axis is scaled differently than the $x$- and $y$-axes. If we scaled all the axes with the same scale, we get a more accurate picture of how steep the plane is. In the below plot, if you look at any of the edges of the graph (along which one of the variables is fixed), you can better see that the height (the $z$ direction) increases with slope of one.
Applet loading
An angled plane. The graph of the function $g(x,y)=x+y$ is shown with all axis at the same scale to better reveal the steepness of the angled plane.
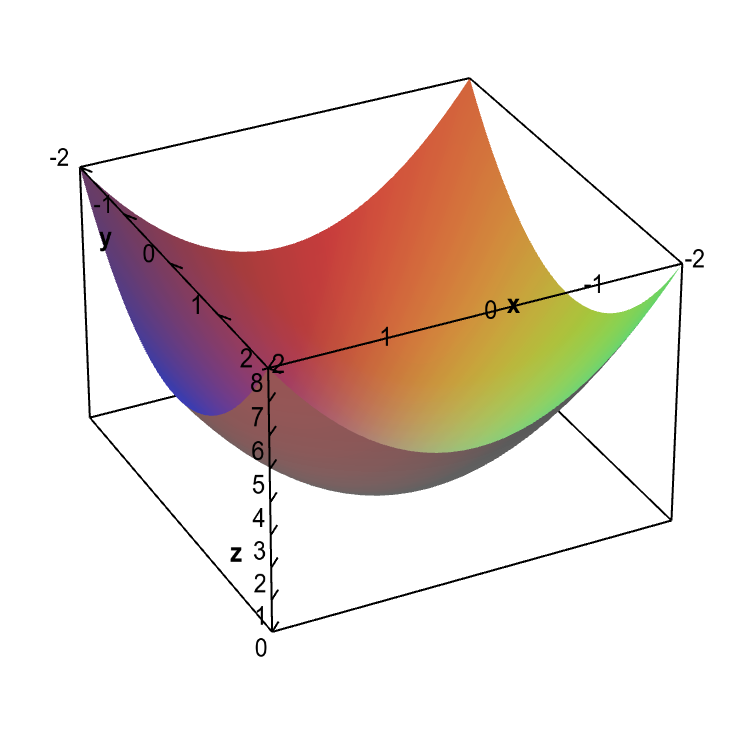
Let's plot a few more examples. You may recall that the graph of the single variable function $f(x)=x^2$ is a parabola. The graph of the function $f(x,y)=x^2+y^2$ is a generalization to two variables. The graph is something called a paraboloid, a type of quadric surface.
Applet loading
An elliptic paraboloid. The graph of the function $f(x,y)=x^2+y^2$ is called an elliptic paraboloid.
One can, of course, plot the graphs of all sorts of functions. Some of the most interesting involve trigonometric functions, such as $f(x,y)=\sin(xy)$.
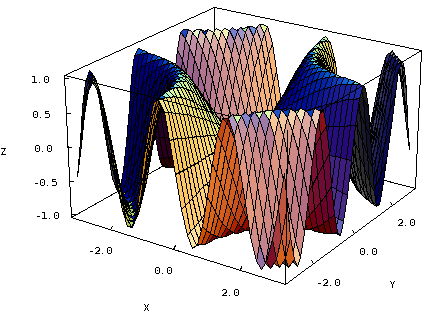
Graph of a trigonometric function. The graph of $f(x,y)=\sin(xy)$ is fairly complicated.