Translation, rescaling, and reflection
If you are given the graph of a function $z=f(x,y)$, how can you find the graph of the function $z=a\,f(x-x_0,y-y_0)+c$ for some numbers $a$, $c$, $x_0$, and $y_0$?
This is exactly analogous to what you've probably already done in one-variable calculus. Changing these numbers (we'll call them parameters) results in a translation, rescaling, and/or reflection of the graph.
Below is an applet that illustrates these manipulations using the function $f(x,y)=x^2+y^2$. Before you play with the sliders, can you tell what will happen as you change the parameters? Once you start to move them, it is obvious. Make sure you understand why the parameters behave as they do. In particular, why do we need to put a minus sign in front of $x_0$ and $y_0$ but not in front of $c$? After all, they each introduce translations.
Here's the graph of the function $$ z=af(x-x_0,y-y_0)+c = a\left[(x-x_0)^2 + (y-y_0)^2\right] +c. $$
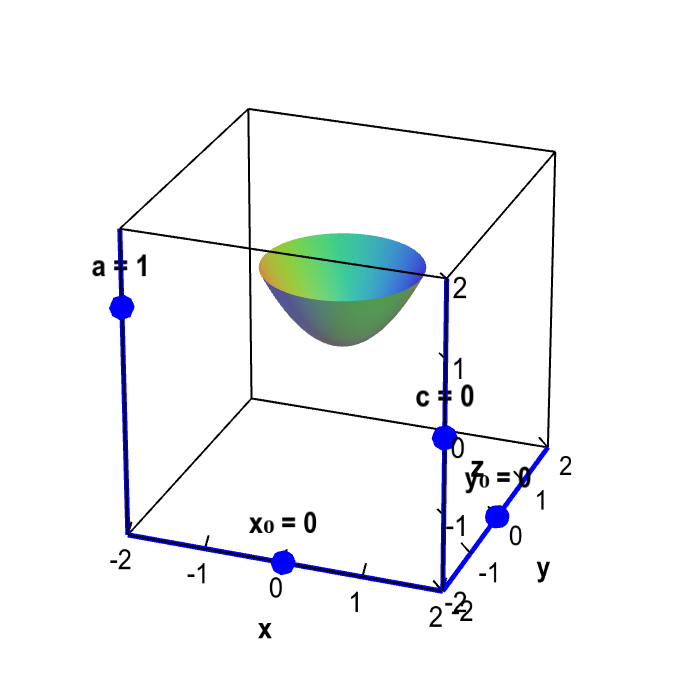
Applet loading
Translation, rescaling, and reflection. You can translate, rescale, and reflect of the graph $f(x,y)=x^2+y^2$, resulting in the graph of $z=af(x-x_0,y-y_0)+c$. Drag the sliders with your mouse to change $a$, $c$, $x_0$, and $y_0$. Changing $c$, $x_0$, and $y_0$ translates the graph. Changing the magnitude of $a$ rescales the graph; changing the sign of $a$ reflects the graph across the plane $z=c$.
Changing $x_0$, $y_0$, or $c$ translates the graph. If we change $a$ but keep its sign constant (for example, keep $a$ positive), then we rescale the figure. But if we change the sign of $a$, then we reflect the graph across the plane $z=c$. For example, the graph of $z=-f(x,y)$ is the reflection of the graph of $z=f(x,y)$ across the $xy$-plane (the plane $z=0$).
Thread navigation
Vector algebra
- Previous: Level set examples
- Next: Surfaces of revolution
Math 2374
- Previous: Function notation
- Next: Introduction to partial derivatives*