Data modeling versus mathematical modeling
When creating models of bacteria growth and penicillin clearance, we based our models on an understanding of the process leading to the observed data. In these cases, we engaged in mathematical modeling of the underlying biology.
In other cases, one can model data in an interesting way and match the pattern of data, but do the modeling in a way in which there is little possibility of building a mathematical model to explain the process. We refer to this modeling as data modeling. Here we outline the difference between data modeling and mathematical modeling by giving some examples of data modeling and contrasting them to the mathematical models above.
Examples of data modeling
Leaf smoothness as function of temperature
Jack A. Wolfe1 observed that leaves of trees growing in cold climates tend to be incised (have ragged edges) and leaves of trees growing in warm climates tend to have smooth edges (lacking lobes or teeth). He measured the percentages of species that have smooth margins among all species of the flora in many locations in eastern Asia. His data, as read from a graph in U. S. Geological Survey Professional Paper 1106, is presented in below.
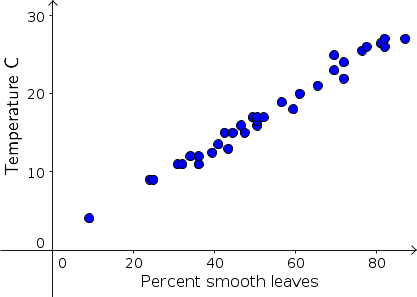
Average temperature °C versus percentage of tree species with smooth edge leaves in 33 forests in eastern Asia. The equation of the line is $y= -0.89 + 0.313 x$.
The line, $$\mbox{temp} =0.89 + 0.313 \times \mbox{% smooth}$$ is shown above and is close to the data. The line was used by Wolfe to estimate temperatures over the last 65 million years based on observed fossil leaf composition. The prospects of writing a mathematical model describing the relationship of smooth edge leaves to temperature are slim, however.
Cricket chirp frequency
On several nights during August and September in Ames, Iowa, some students listened to crickets chirping. They counted the number of chirps in a minute (chirp rate, $R$) and also recorded the air (ambient) temperature ($T$) in °F for the night. The data were collected between 9:30 and 10:00 pm each night, and are shown in the following table and graph.
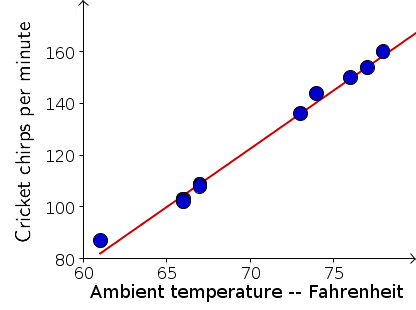
A table and graph of the frequency of cricket chirps versus temperature in degrees F
These data also appear linear and the line through (65,100) and (75,145), \begin{align*}\frac{R - 100}{T - 65} &= \frac{145 - 100}{75 - 65}\\ R &= 4.5 T - 192.5 \end{align*} lies close to the data. We can use the line to estimate temperature to be about 69.5 °F if cricket chirp rate is 120 chirps/minute.
Both of these examples are examples of data modeling. We fit a line to the data, but there is no underlying explanation of what mechanism is causing the relation.