List of images
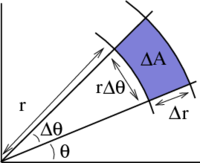 Image: Area calculation for changing variables to polar coordinates
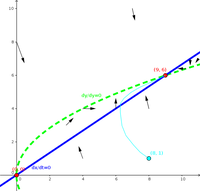
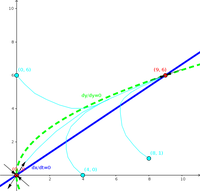
An illustration motivating the change of variable formula for polar coordinates. Image: Polar coordinates to Cartesian coordinates
One can derive the formula to convert polar coordinates into Cartesian coordinates using simple trigonometry. Image: Power law degree distribution
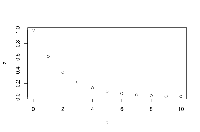
Histograms of a power law degree distribution of a network with 10,000 nodes. Image: Plot of power-law degree distribution on log-log scale
In a scatter plot of a power-law degree distribution on log-log scale, points lie approximately along a line. Image: Quarter circle in three dimensions
A curve representing the oriented boundary of a quarter unit disk in the yz-plane. Image: Three parts of quarter circle in three dimensions
A curve representing the oriented boundary of a quarter unit disk in the yz-plane, divided into three curves.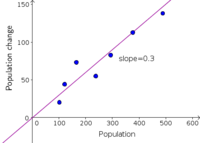 Image: The change of a rabbit population versus population size
Scatter plot of the change of a rabbit population versus population size, fitted with a line. Image: Rectangle chopped into smaller rectangles
A rectangle is chopped into smaller rectangles, which is a first step toward creating a Riemann sum defining a double integral over the rectangle.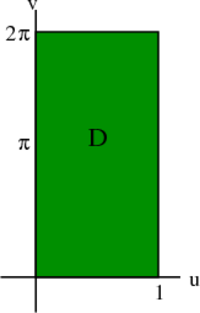 Image: Rectangular domain to be mapped into helicoid
Illustration of a rectangular domain that is mapped into a helicoid. Image: A rectangle in the plane $y=1$.
A rectangle in the plane y=1.


« Previous
| Page 12 of 16 |
Next »