A line or a plane or a point?
Example 1: $y=3x-2$
Is the graph of $y=3x-2$ the graph of a line or a plane or a point? You might recognize this as a familiar form of the equation of a line with slope 3 and $y$-intercept $-2$, as in the following graph.
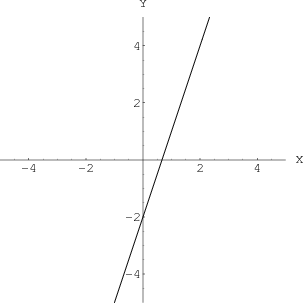
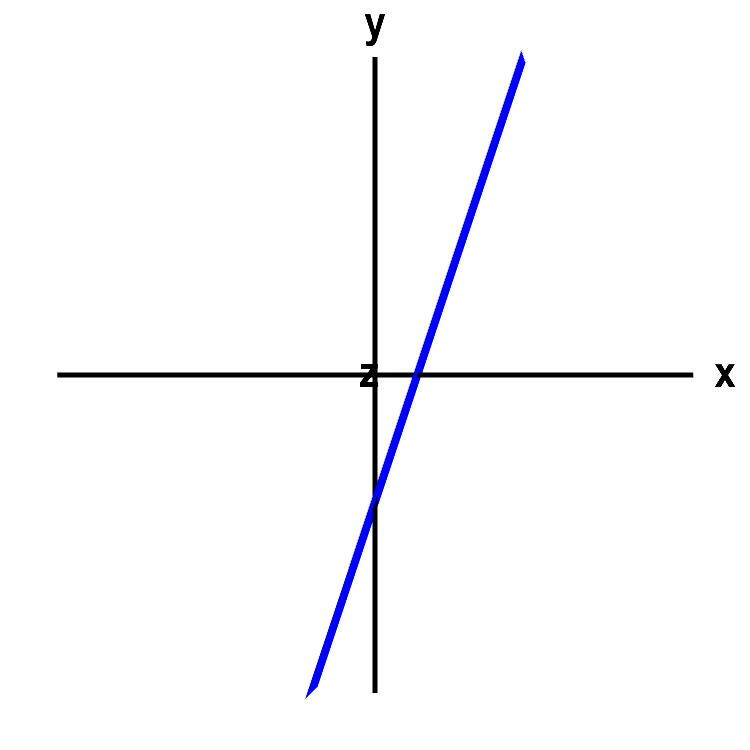
However, if we think $y=3x-2$ is a line, we have implicitly assumed that the equation $y=3x-2$ is an equation in two dimensions, i.e., in the two variables $x$ and $y$. It could actually be an equation in three dimensions, say with the variables $x$, $y$, and $z$. Although the $z$ doesn't appear in the equation, we could think of the equation as having a $z$ with a coefficient of zero. We could write the equation as $y=3x+0z-2$. Here's what plotting the equation $y=3x-2$ in a three-dimensional coordinate system looks like.
Applet loading
An angled line or a plane. The graph of the equation $y=3x-2$ looks like a line, which it would be if were an equation in two dimensions, i.e., in the $xy$-plane. However, rotate the graph with the mouse to give you a new perspective on the graph. Since in this case, the graph is really in three dimensions, the graph of the equation becomes a plane. The equation just happens to not depend on the variable $z$, so the plane is parallel to the $z$-axis.
Before rotating, the graph looks like the previous one, as the $z$ dimension is hidden. The fact that the graph is a plane doesn't become obvious until you rotate the axis.
We conclude that we don't know what the graph of $y=3x-2$ is unless we specify the number of dimensions. If we want to specify a line, one way is to use a parametrization of a line. The parametrization of a line has the advantage that it gives you a line no matter how many dimensions you are working in.
Example 2: $x=3$
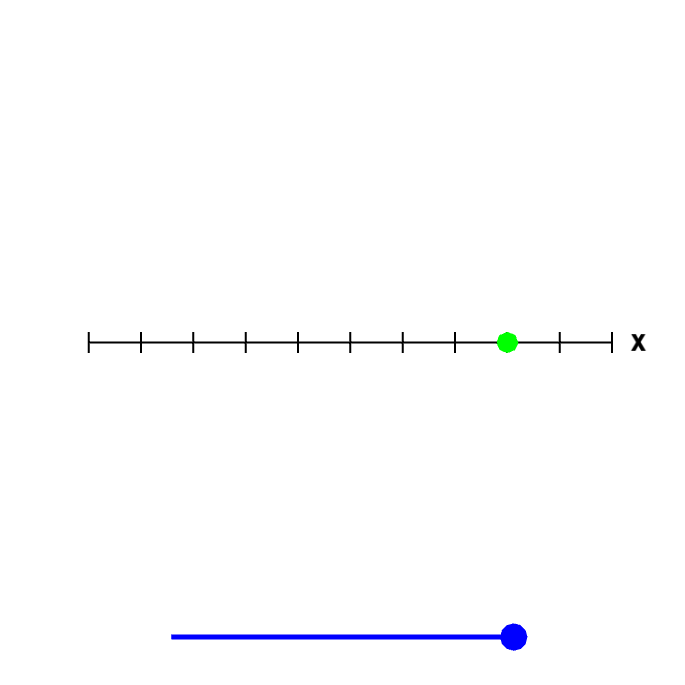
Is the graph of $x=3$ the graph of a line or a plane or a point? Just like above, the answer will depend on the dimensions we are working in. In one dimension, $x=3$ is just a point, as in a point on the number line.
In two dimensions, the graph is a line, as you can see by rotating the below graph.
Applet loading
A point or a line.
The graph of the equation $x=3$ could be a point, if it were an equation in one variable. But, in this case, it is an equation in two dimensions, in the variables $x$ and $y$ (where the coefficient of $y$ just happens to be zero). Rotate the figure by moving the blue point on the slider to the left to see that, since it is a graph in two dimensions, the graph is really a line.
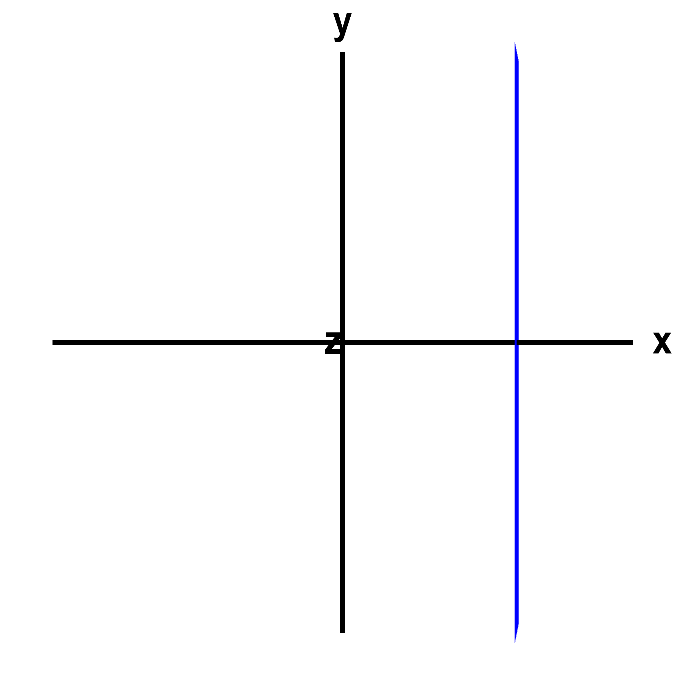
And, in three dimensions, the graph of $x=3$ is a plane.
Applet loading
A vertical line or a plane. The graph of $x=3$ would be a line, if it were an equation in two dimensions, in terms of the variables $x$ and $y$, for example. However, here it is an equation in three dimensions, in terms of the variables $x$, $y$, and $z$, so that its graph is really a plane. Rotate the graph with you mouse to see this fact. Since the equation does not depend on $y$ or $z$, the plane is parallel to both the $y$ and the $z$ axis. You can press Home to restore the original view.
Thread navigation
Vector algebra
- Previous: Forming plane examples
- Next: Distance from point to plane
Math 2374
- Previous: Forming plane examples
- Next: Distance from point to plane
Similar pages
- Distance from point to plane
- Distance from point to plane example
- Intersecting planes example
- Parametrization of a line
- Parametrization of a line examples
- Forming planes
- Forming plane examples
- Vectors in arbitrary dimensions
- Examples of n-dimensional vectors
- Parametrization of a plane
- More similar pages