Level set examples
Example 1
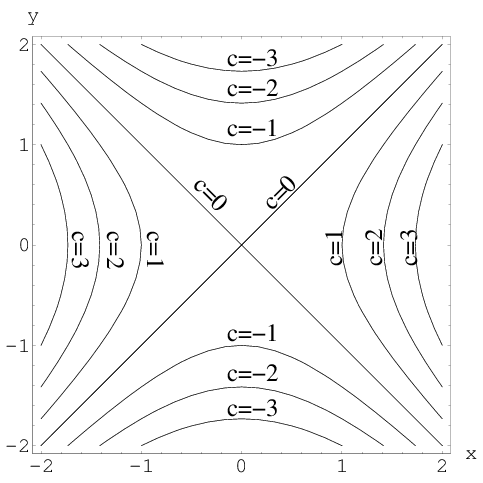
Let $f(x,y) = x^2-y^2$. We will study the level curves $c=x^2-y^2$.
First, look at the case $c=0$. The level curve equation $x^2-y^2=0$ factors to $(x-y)(x+y)=0$. This equation is satisfied if either $y=x$ or $y=-x$. Both these are equations for lines, so the level curve for $c=0$ is two lines.
If $c \ne 0$, then we can rewrite the level curve equation $c=x^2-y^2$ as \begin{align*} 1 = \frac{x^2}{c} - \frac{y^2}{c}. \end{align*} If you remember you conic sections, you'll recognize this as the equation for a hyperbola. If $c$ is positive, the hyperbolas open to the left and right. If $c$ is negative, the hyperbolas open up and down.
For example, if $c=1$, the equation is $x^2-y^2=1$. If $c=-1$, the equation is $y^2-x^2=1$. A number of level curves are plotted below.
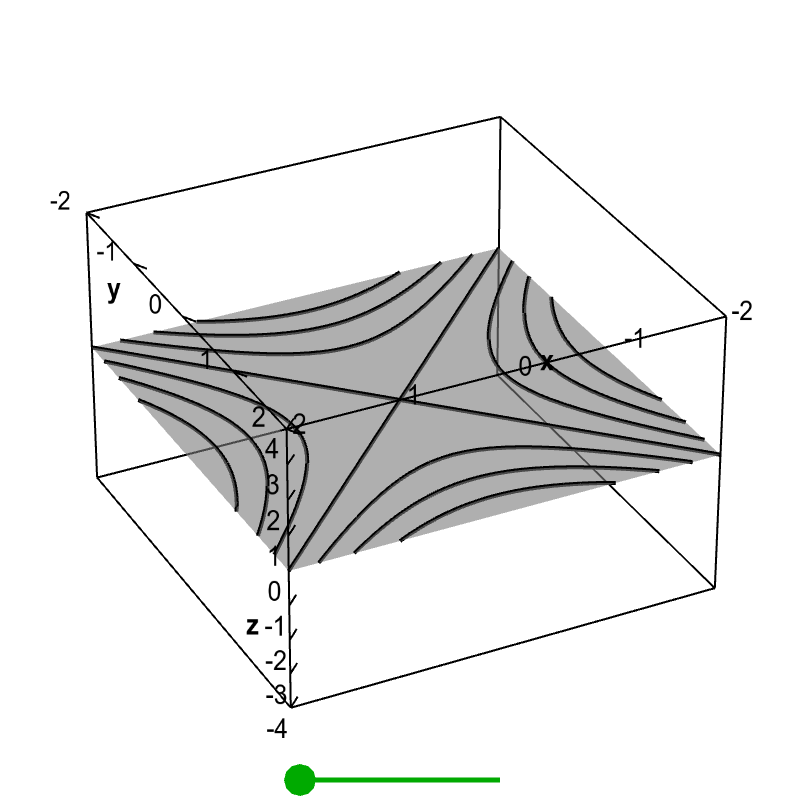
We can “stack” these level curves on top of one another to form the graph of the function. Below, the level curves are shown floating in a three-dimensional plot. Drag the green point to the right. When the green point is all the way to the right, each level curve given by $c=f(x,y)$ will be at the height $z=c$.
Applet loading
Level curves of a hyperbolic paraboloid. When the green point on the slider is to the left, as it is in the default view, the figure shows a standard level curve plot of $f(x,y)=x^2-y^2$, though it is floating in a three dimensional space. When you drag the green point to the right, each level curve $f(x,y)=c$ moves to the height $z=c$, so that they are in the same position as in the graph of $z=f(x,y)$. In this way, the figure demonstrates the correspondence between the level curve plot and the graph of the function.
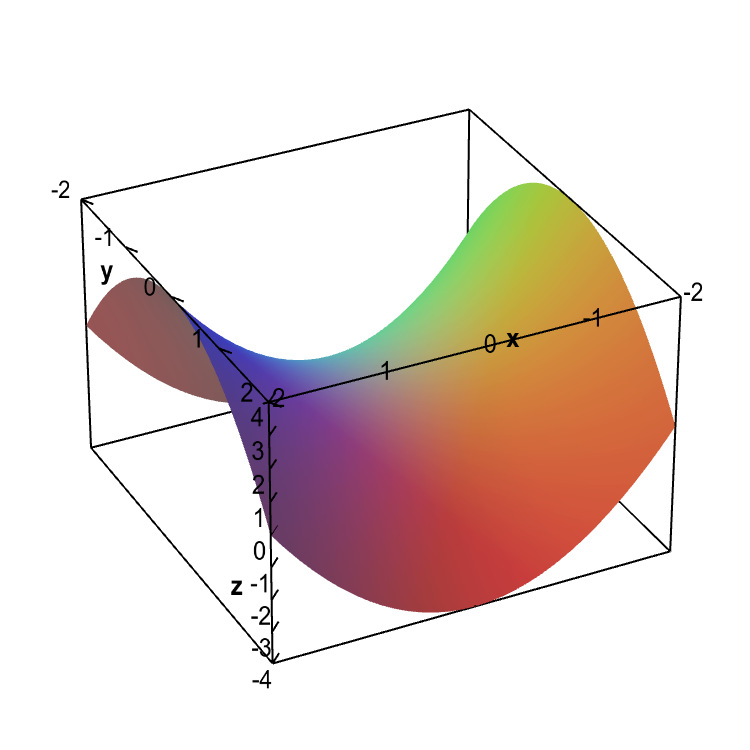
This is yet another way to visualize the relationship between the level curves and the graph of $z=f(x,y)$ shown below, which is a hyperbolic paraboloid.
Applet loading
Graph of a hyperbolic paraboloid. The graph of the function $f(x,y)=x^2-y^2$.
Example 2
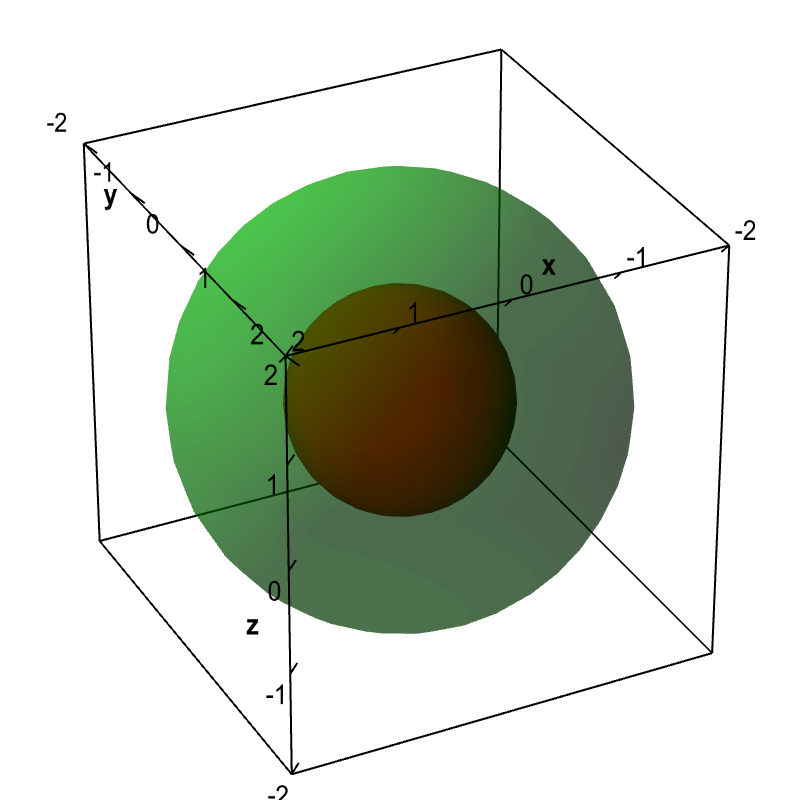
Let $f(x,y,z) = x^2+y^2+z^2$. Although we cannot plot the graph of this function, we can graph some of its level surfaces. The equation for a level surface, $x^2+y^2+z^2=c$, is the equation for a sphere of radius $\sqrt{c}$.
Applet loading
Spherical level surfaces. The level surfaces $f(x,y,z) = x^2+y^2+z^2=c$ are spheres of radius $\sqrt{c}$. The level surface with $c=1$ is the sphere of radius 1 drawn in dark red. The level surface with $c=4$ is the sphere of radius 2 drawn in light green.
Thread navigation
Vector algebra
- Previous: Level sets
- Next: Translation, rescaling, and reflection
Math 2374
- Previous: Level sets*
- Next: Function notation
Similar pages
- Level sets
- Translation, rescaling, and reflection
- An introduction to parametrized curves
- An introduction to the directional derivative and the gradient
- Surfaces of revolution
- Surfaces as graphs of functions
- Surfaces defined implicitly
- Quadric surfaces
- Cross sections of a surface
- The elliptic paraboloid
- More similar pages