Vector field overview
This overview introduces the basic concept of vector fields in two or three dimensions.
Vector fields in two dimensions
A vector-valued function $\dlvf:\R^2 \rightarrow \R^2$ (confused?) can be visualized as a vector field. At a point $(x,y)$, we plot the value of $\dlvf(x,y)$ as a vector with tail anchored at $(x,y)$, such as in the following figure.
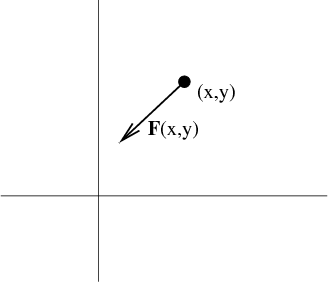
We repeat this over a set of points $(x,y)$ so that we can visualize the entire vector field.
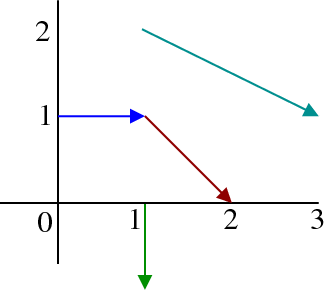
For example, consider the function $\dlvf(x,y) = (y, -x)$. We calculate values of the function at a set of points, such as \begin{align*} \dlvf(1,0)&=\color{#005000}{(0,-1)},\\ \dlvf(0,1)&=\color{blue}{(1,0)},\\ \dlvf(1,1)&=\color{#800000}{(1,-1)},\\ \dlvf(1,2)&=\color{#005080}{(2,-1)}. \end{align*} By plotting each of these vectors anchored at the corresponding points, we begin to see some of the structure of the vector field.
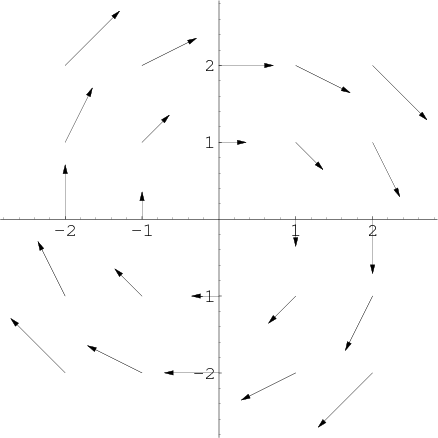
If we continued plotting such vectors at many points, they would begin to overlap and look quite messy. Hence, we typically scale the arrows in vector field plots (usually without commenting on this fact). In the below example, we drew the vectors at only 40% their actual length. By plotting this field of arrows, we see that the vector field $\dlvf(x,y) = (y, -x)$ appears to rotate in a clockwise direction.
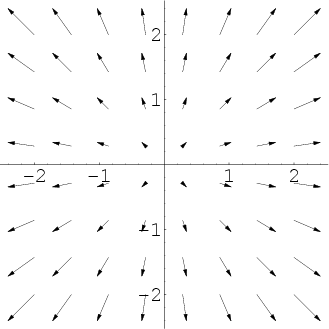
If we visualize in this way the vector field $\dlvf(x,y) = (x,y)$, it looks like an explosion emanating from the origin. At each point $(x,y)$, the vector $\dlvf(x,y)$ points precisely away form the origin. If we drew the arrows to scale, they would be as long as the distance to the origin, but again, the drawn arrows are shorter than the actual values of the vector field.
Vector fields in three dimensions
We can also plot vector fields in three dimensions, i.e., for functions $\dlvf: \R^3 \rightarrow \R^3$. The principle is exactly the same; we plot vectors of length proportional to $\dlvf(x,y,z)$ with tail anchored at the point $(x,y,z)$. In three dimensions, vector fields are harder to visualize. Rotating the graphs can make the three-dimensional structure more apparent.
For example, the three-dimensional analogue of the above picture would be $\dlvf(x,y,z)=(x,y,z)$. As in the two-dimesional case, this vector field corresponds to an explosion from the origin. In the below graph, we show only the portion of the vector field with $x>0$, $y>0$, and $z>0$.
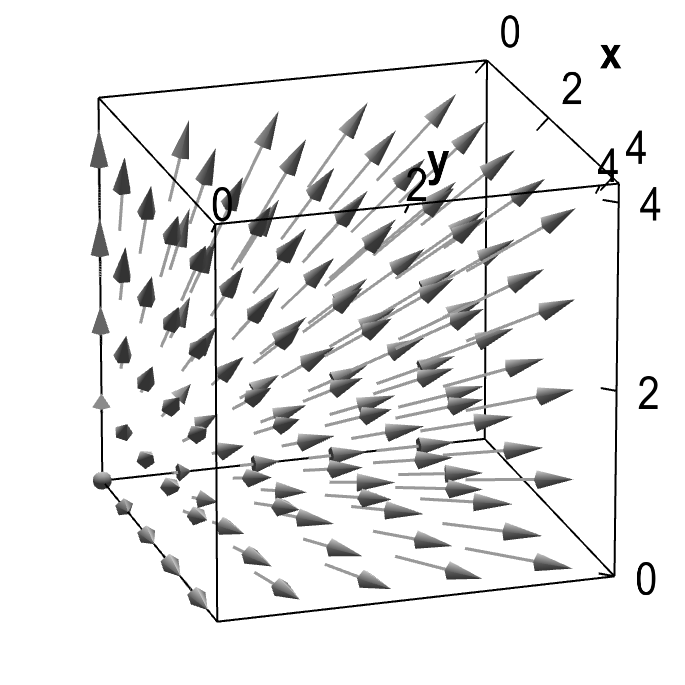
Applet loading
Expanding three-dimensional vector field. You can rotate the graph with the mouse to give perspective.
The vector field $\dlvf(x,y,z)=(y/z,-x/z,0)$ corresponds to a rotation in three dimensions, where the vector rotates around the $z$-axis. This vector field is similar to the two-dimensional rotation above. In this case, since we divided by $z$, the magnitude of the vector field decreases as $z$ increases.
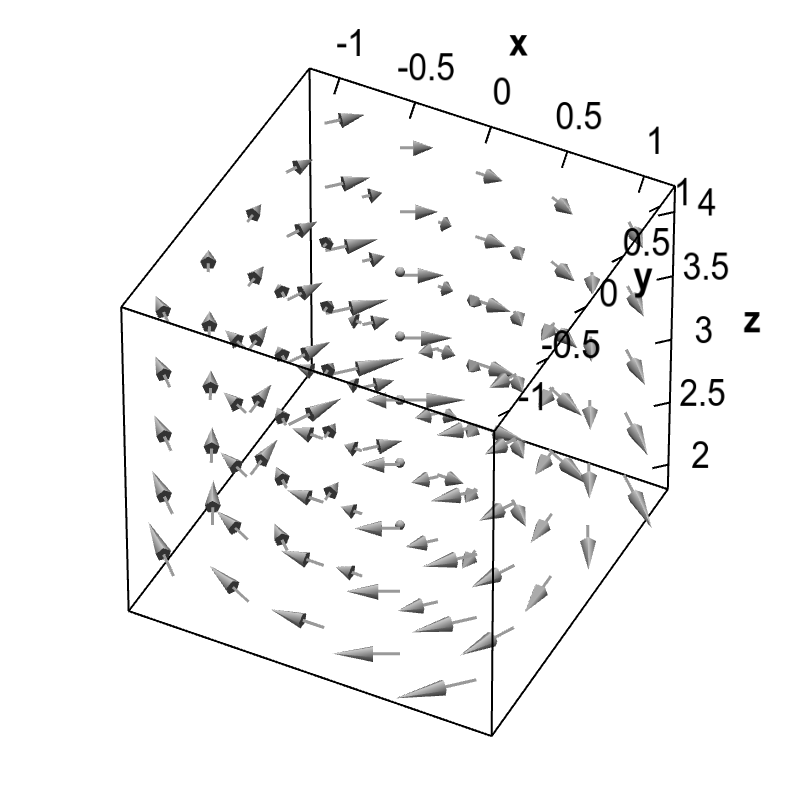
Applet loading
A three-dimensional rotating vector field. You can rotate the graph with the mouse to give perspective.
In general, the behavior of a three-dimensional vector field isn't so easy to see from the graph. For example, the structure of the vector field $\dlvf = (-y, xy,z)$ is harder to see from the graph.
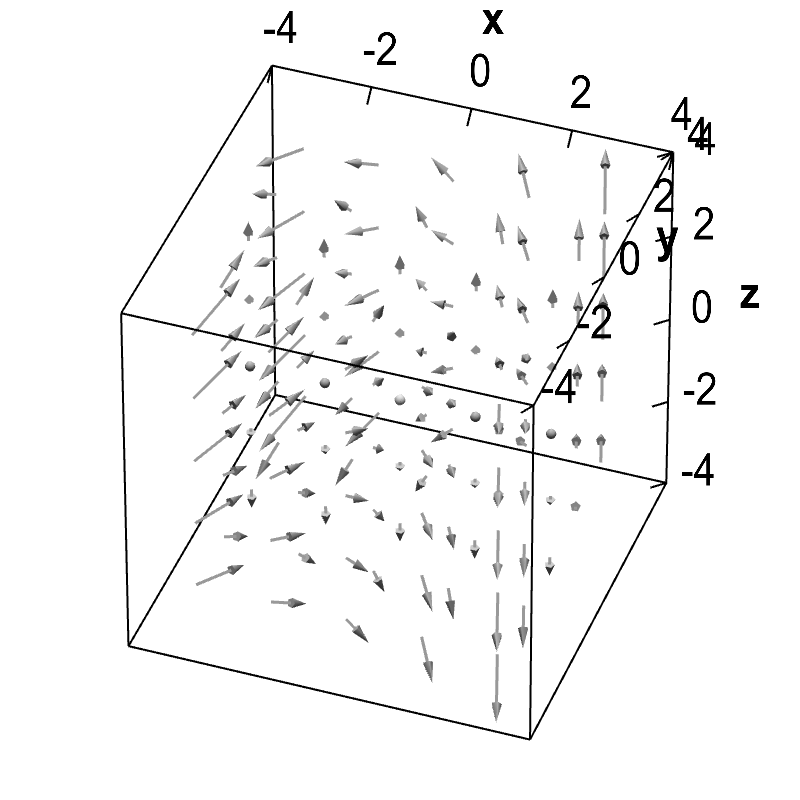
Applet loading
Example three-dimensional vector field. The structure of the vector field is difficult to visualize, but rotating the graph with the mouse helps a little.
Thread navigation
Multivariable calculus
- Previous: Parametrized surface area example
- Next: Vector fields as fluid flow
Math 2374
- Previous: Parametrized curve arc length examples
- Next: Vector fields as fluid flow
Similar pages
- Vector fields as fluid flow
- The idea of the divergence of a vector field
- Subtleties about divergence
- The idea of the curl of a vector field
- Subtleties about curl
- The components of the curl
- Divergence and curl notation
- Divergence and curl example
- Introduction to a line integral of a vector field
- Alternate notation for vector line integrals
- More similar pages